Integration Dashboards
Integration Dashboards provide detailed insights into the API requests you send us, the responses you receive, and any errors that occur. These dashboards help you quickly evaluate your integration's performance and identify areas for improvement, aiming to increase your successful transactions. Access real-time data and optimize your payment processes effortlessly.
Within the dashboards, you have access to four main pages: Dashboard, API Logs, Webhook Logs, and Error Overview.
Key benefits
- Boost successful transactions: analyze and refine your API requests and errors to boost transaction success rates.
- Real-time monitoring: watch your integration's performance and see the effects of new releases as they happen.
- Comprehensive overview: view the count of successful and failed API requests in a single, unified dashboard.
- Webhook analysis: dive deep into the details of your webhook events for better performance.
- Error insights: quickly identify and address areas for improvement with a detailed error overview.
How to access Integration Dashboards
The dashboards are available in pre-production and production environments. They allow you to see the details of all merchant IDs linked to your account.
- Log in to the Configuration Center of the chosen environment.
- Select "Integration Dashboards" from the menu to have them opened in a new tab.
Dashboard page
This page displays graphs showing API requests and webhook events, offering a visual summary of your API integration. You can view API requests and webhook events received over a selected time period, including details of failed requests and/or events and their HTTP codes.
API request graphs
These graphs visually represent your API activity. For more details, click "View selection in API Logs." By default, the graphs show API logs from the last 15 minutes.
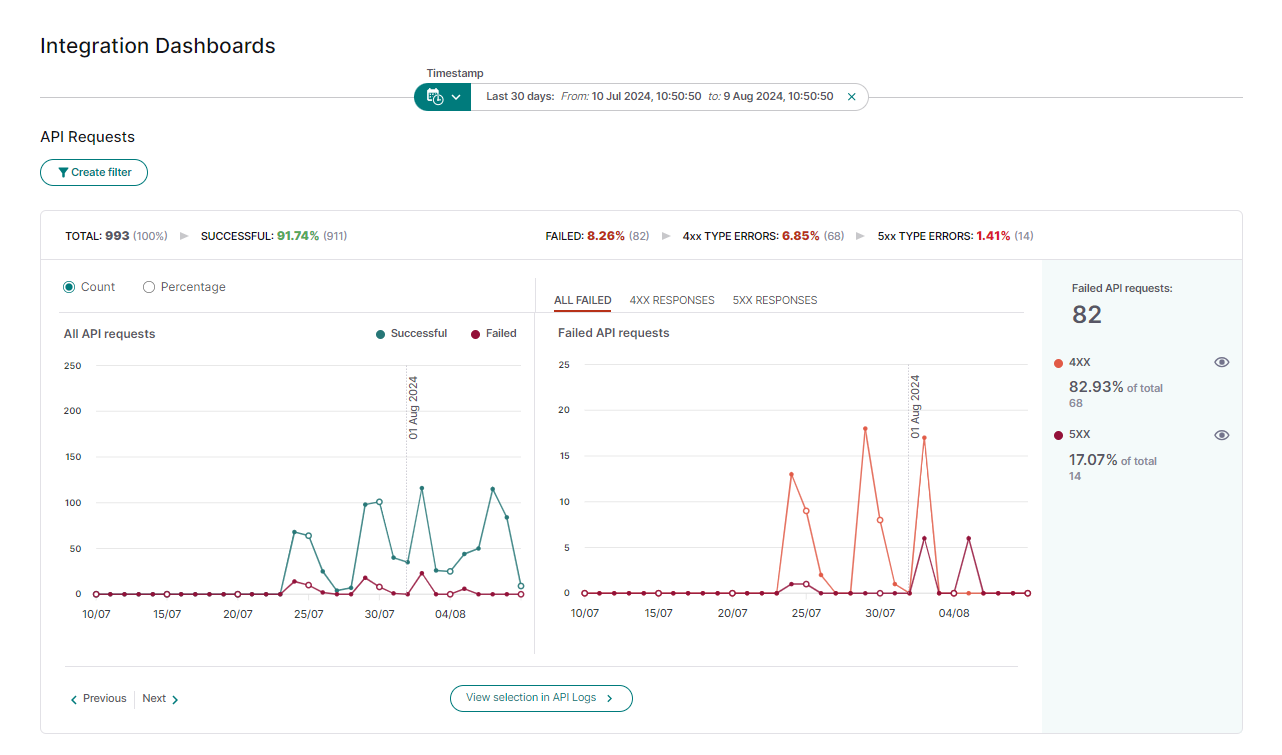
All API requests:
- Displays all API requests (green for successful, red for failed).
- Toggle between "Count" or "Percentage" views using the labels in the upper-left corner.
Failed API requests:
- Displays failed requests by HTTP error types
(e.g., 4xx, 5xx). - View in "Count" or "Percentage" mode.
- Switch to detailed views for specific errors (e.g., 400, 402, 403 for 4xx).
- Hide specific errors by clicking the eye icon next to the error type.
Webhooks graphs
These graphs show your webhook activity. For more details, click "View selection in Webhook Logs." By default, the graphs show webhook logs from the last 15 minutes.
All delivery attempts:
This graph shows all the webhooks delivery attempts (successful in green and failed in red)
You can view the graph in two modes which are "Count" and "Percentage", by clicking on the labels on the upper left corner.
Failed webhooks delivery attempts:
This graph shows the failed webhook delivery attempts and further separates them into the type of HTTP errors
- You can view this graph in "Count" or "Percentage" mode.
- You can switch the view of the second graph to explore detailed breakdowns of error types, such as specific 4XX errors like 401 and 404. You can also hide specific errors by clicking the eye icon next to the error type.
API Logs Page
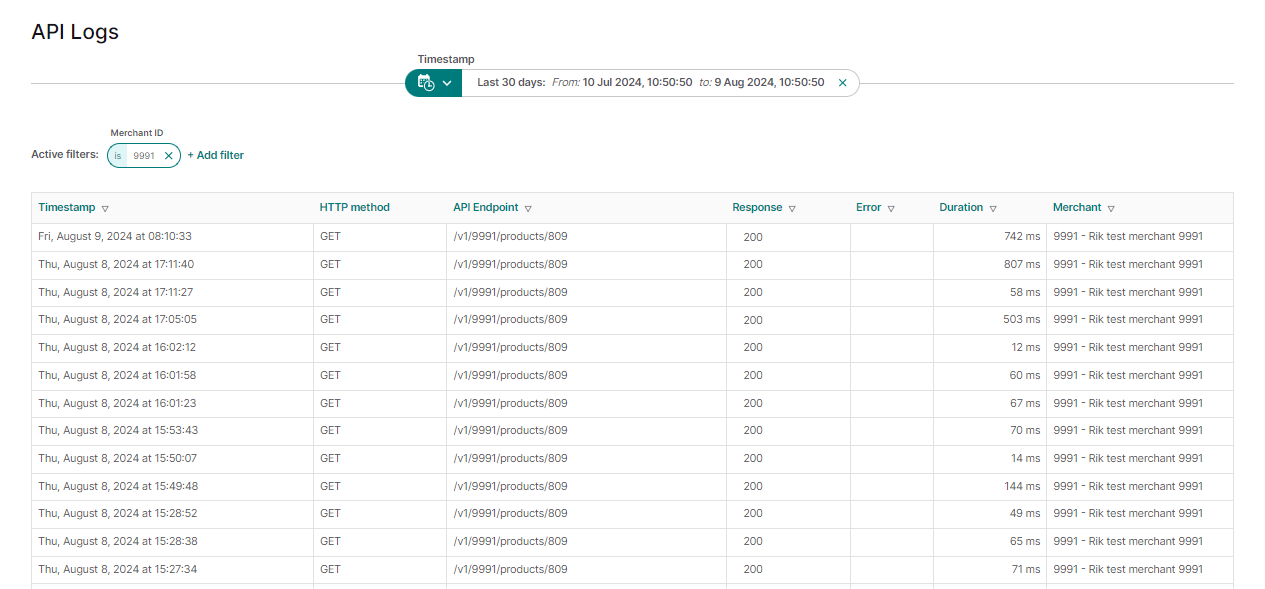
The API Logs page features a table listing detailed information about each API request and response, including:
- Timestamp
- HTTP Method
- API Endpoint
- Response (HTTP response code)
- Error (codes and messages, if any)
- Duration (time between request and response)
- Your merchant ID and company name as registered with us
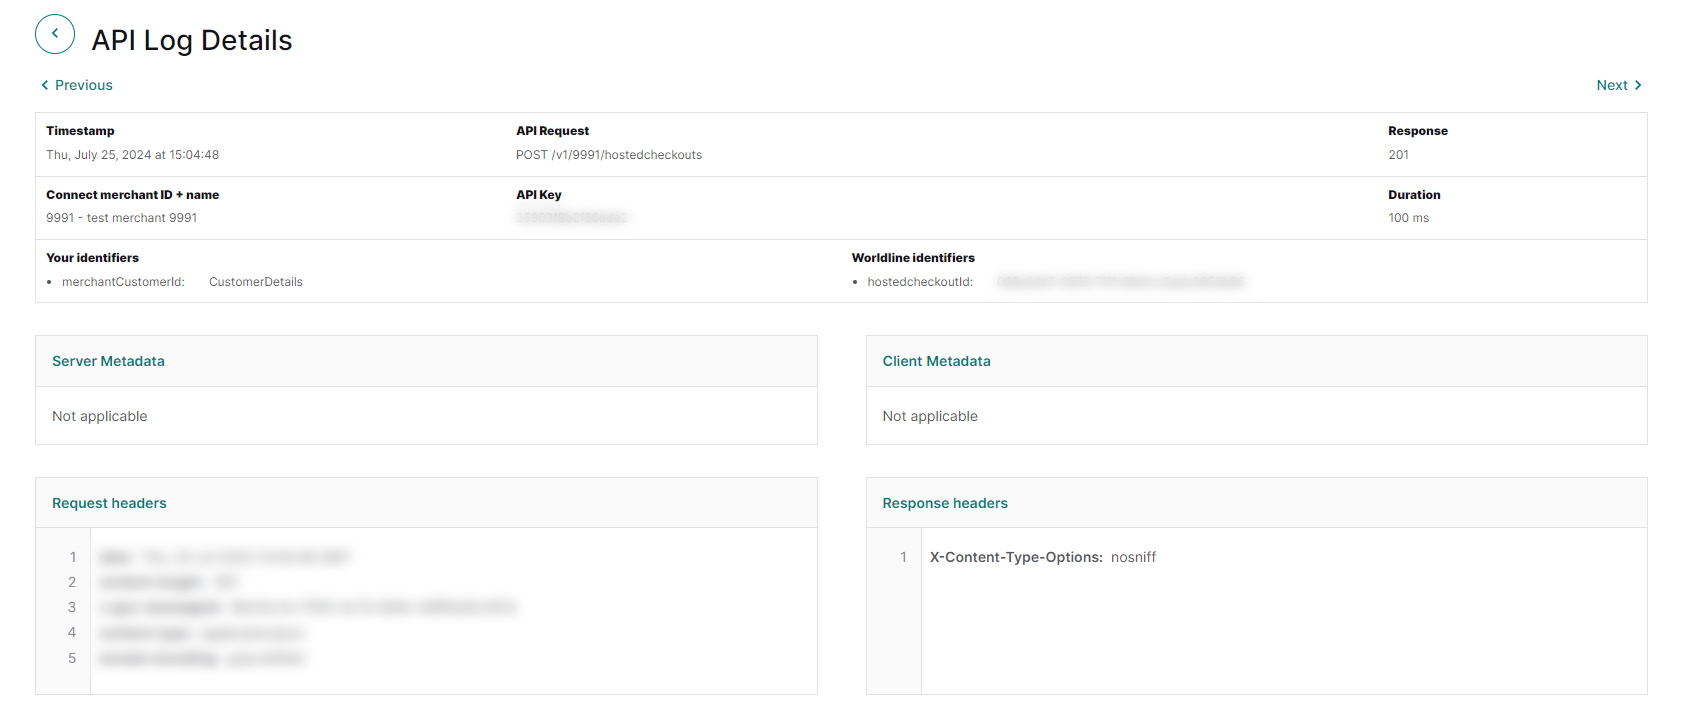
API Log Details
View the specifics of an API request and response, including additional information such as duration, endpoint, and request details:
- Timestamp
- API Request (HTTP Method and API Endpoint)
- Response (HTTP response code)
- Your connect merchant ID and name
- Public API Key used for the call
- Duration (the time between API request and response)
- Your identifiers (e.g., merchantReference)
- Worldline identifiers
- Server and client metadata
- Request and response data (headers and body)
Webhook Logs Page
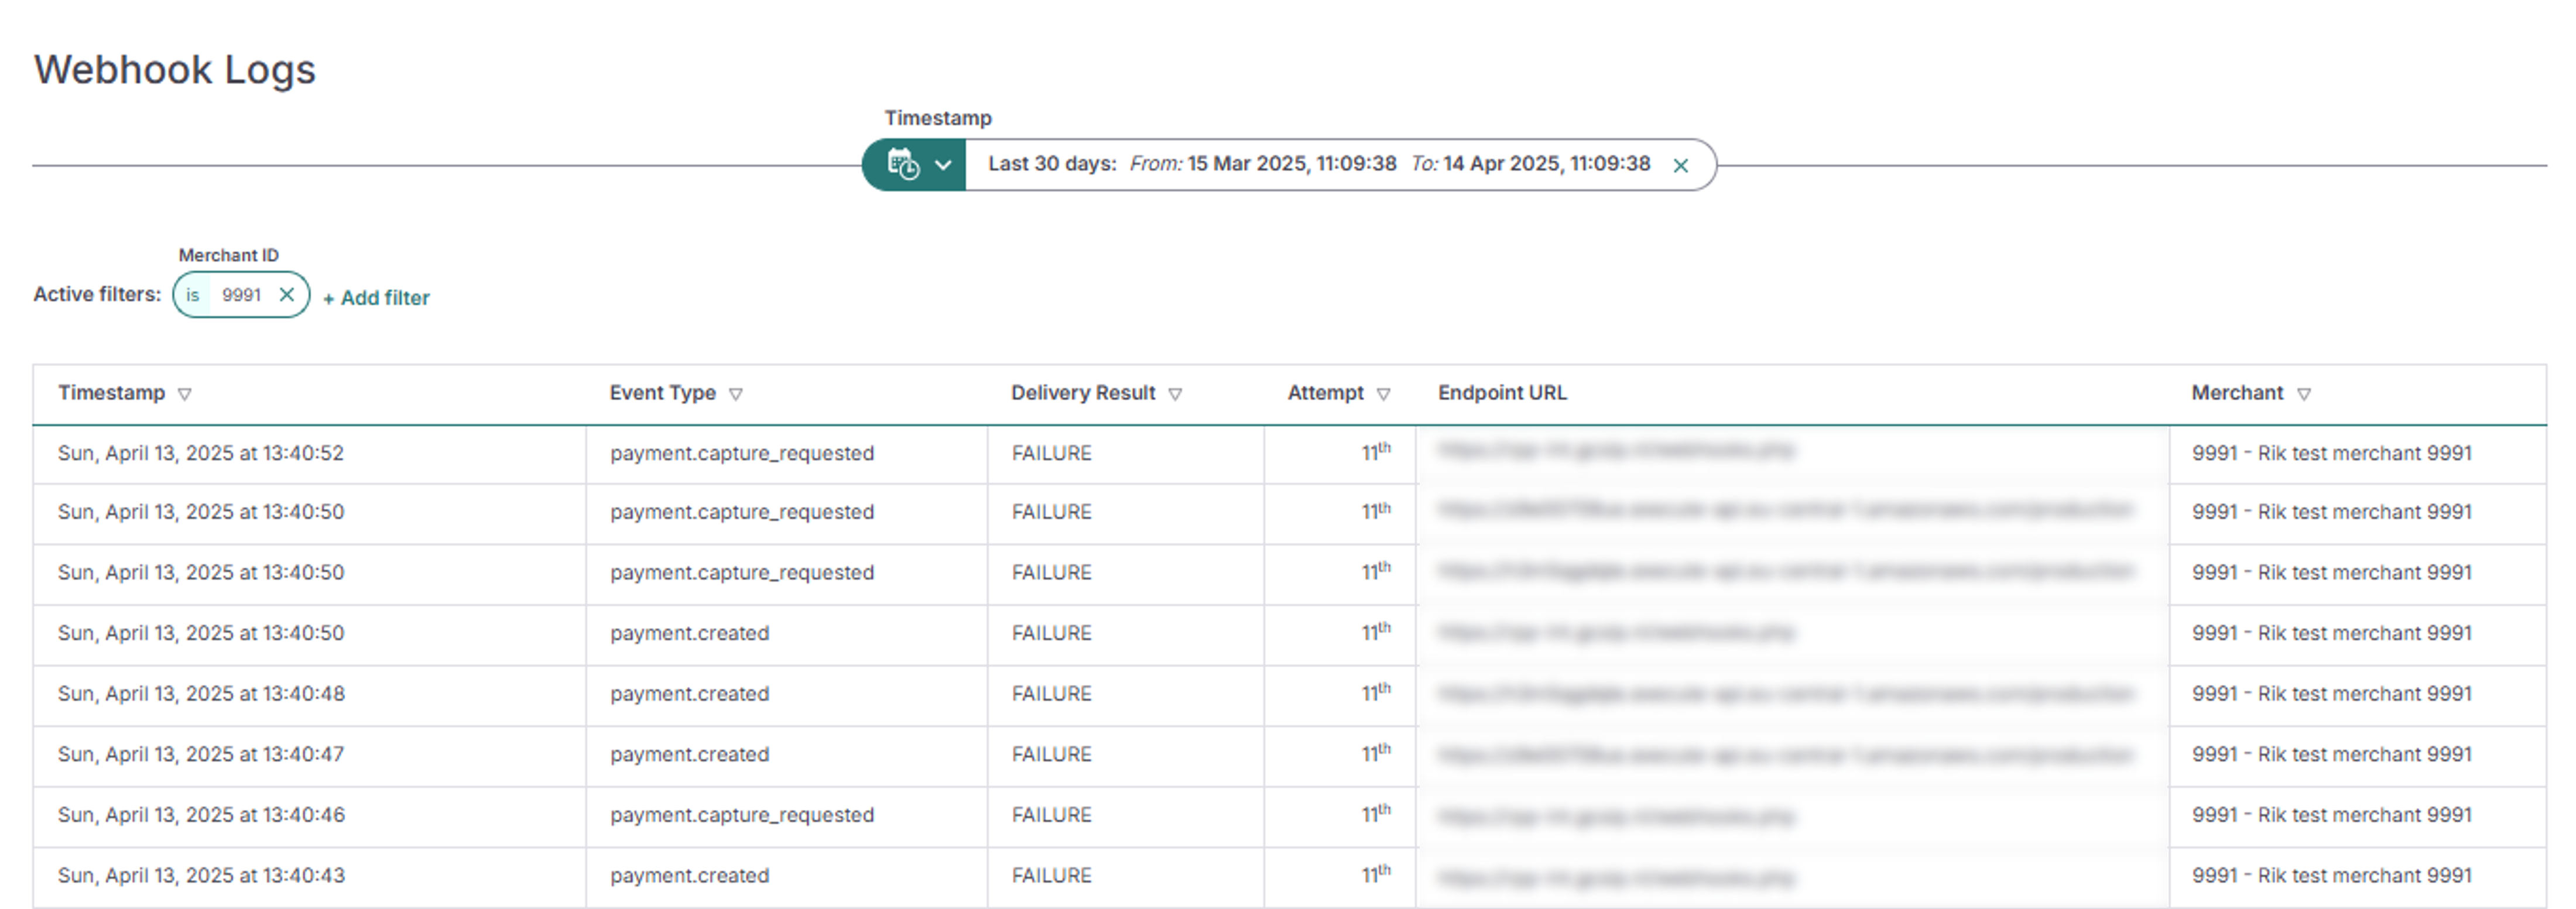
The Webhook Logs page features a table listing detailed information about each webhook event sent, including:
- Timestamp
- Event Type (see here for possible event names)
- Delivery Result (Indicates whether we could deliver the notification to your endpoint)
- Attempt (number of retries)
- Endpoint URL (The webhook endpoint you have configured to receive the specific webhook event)
- Your merchant ID and company name as registered with us
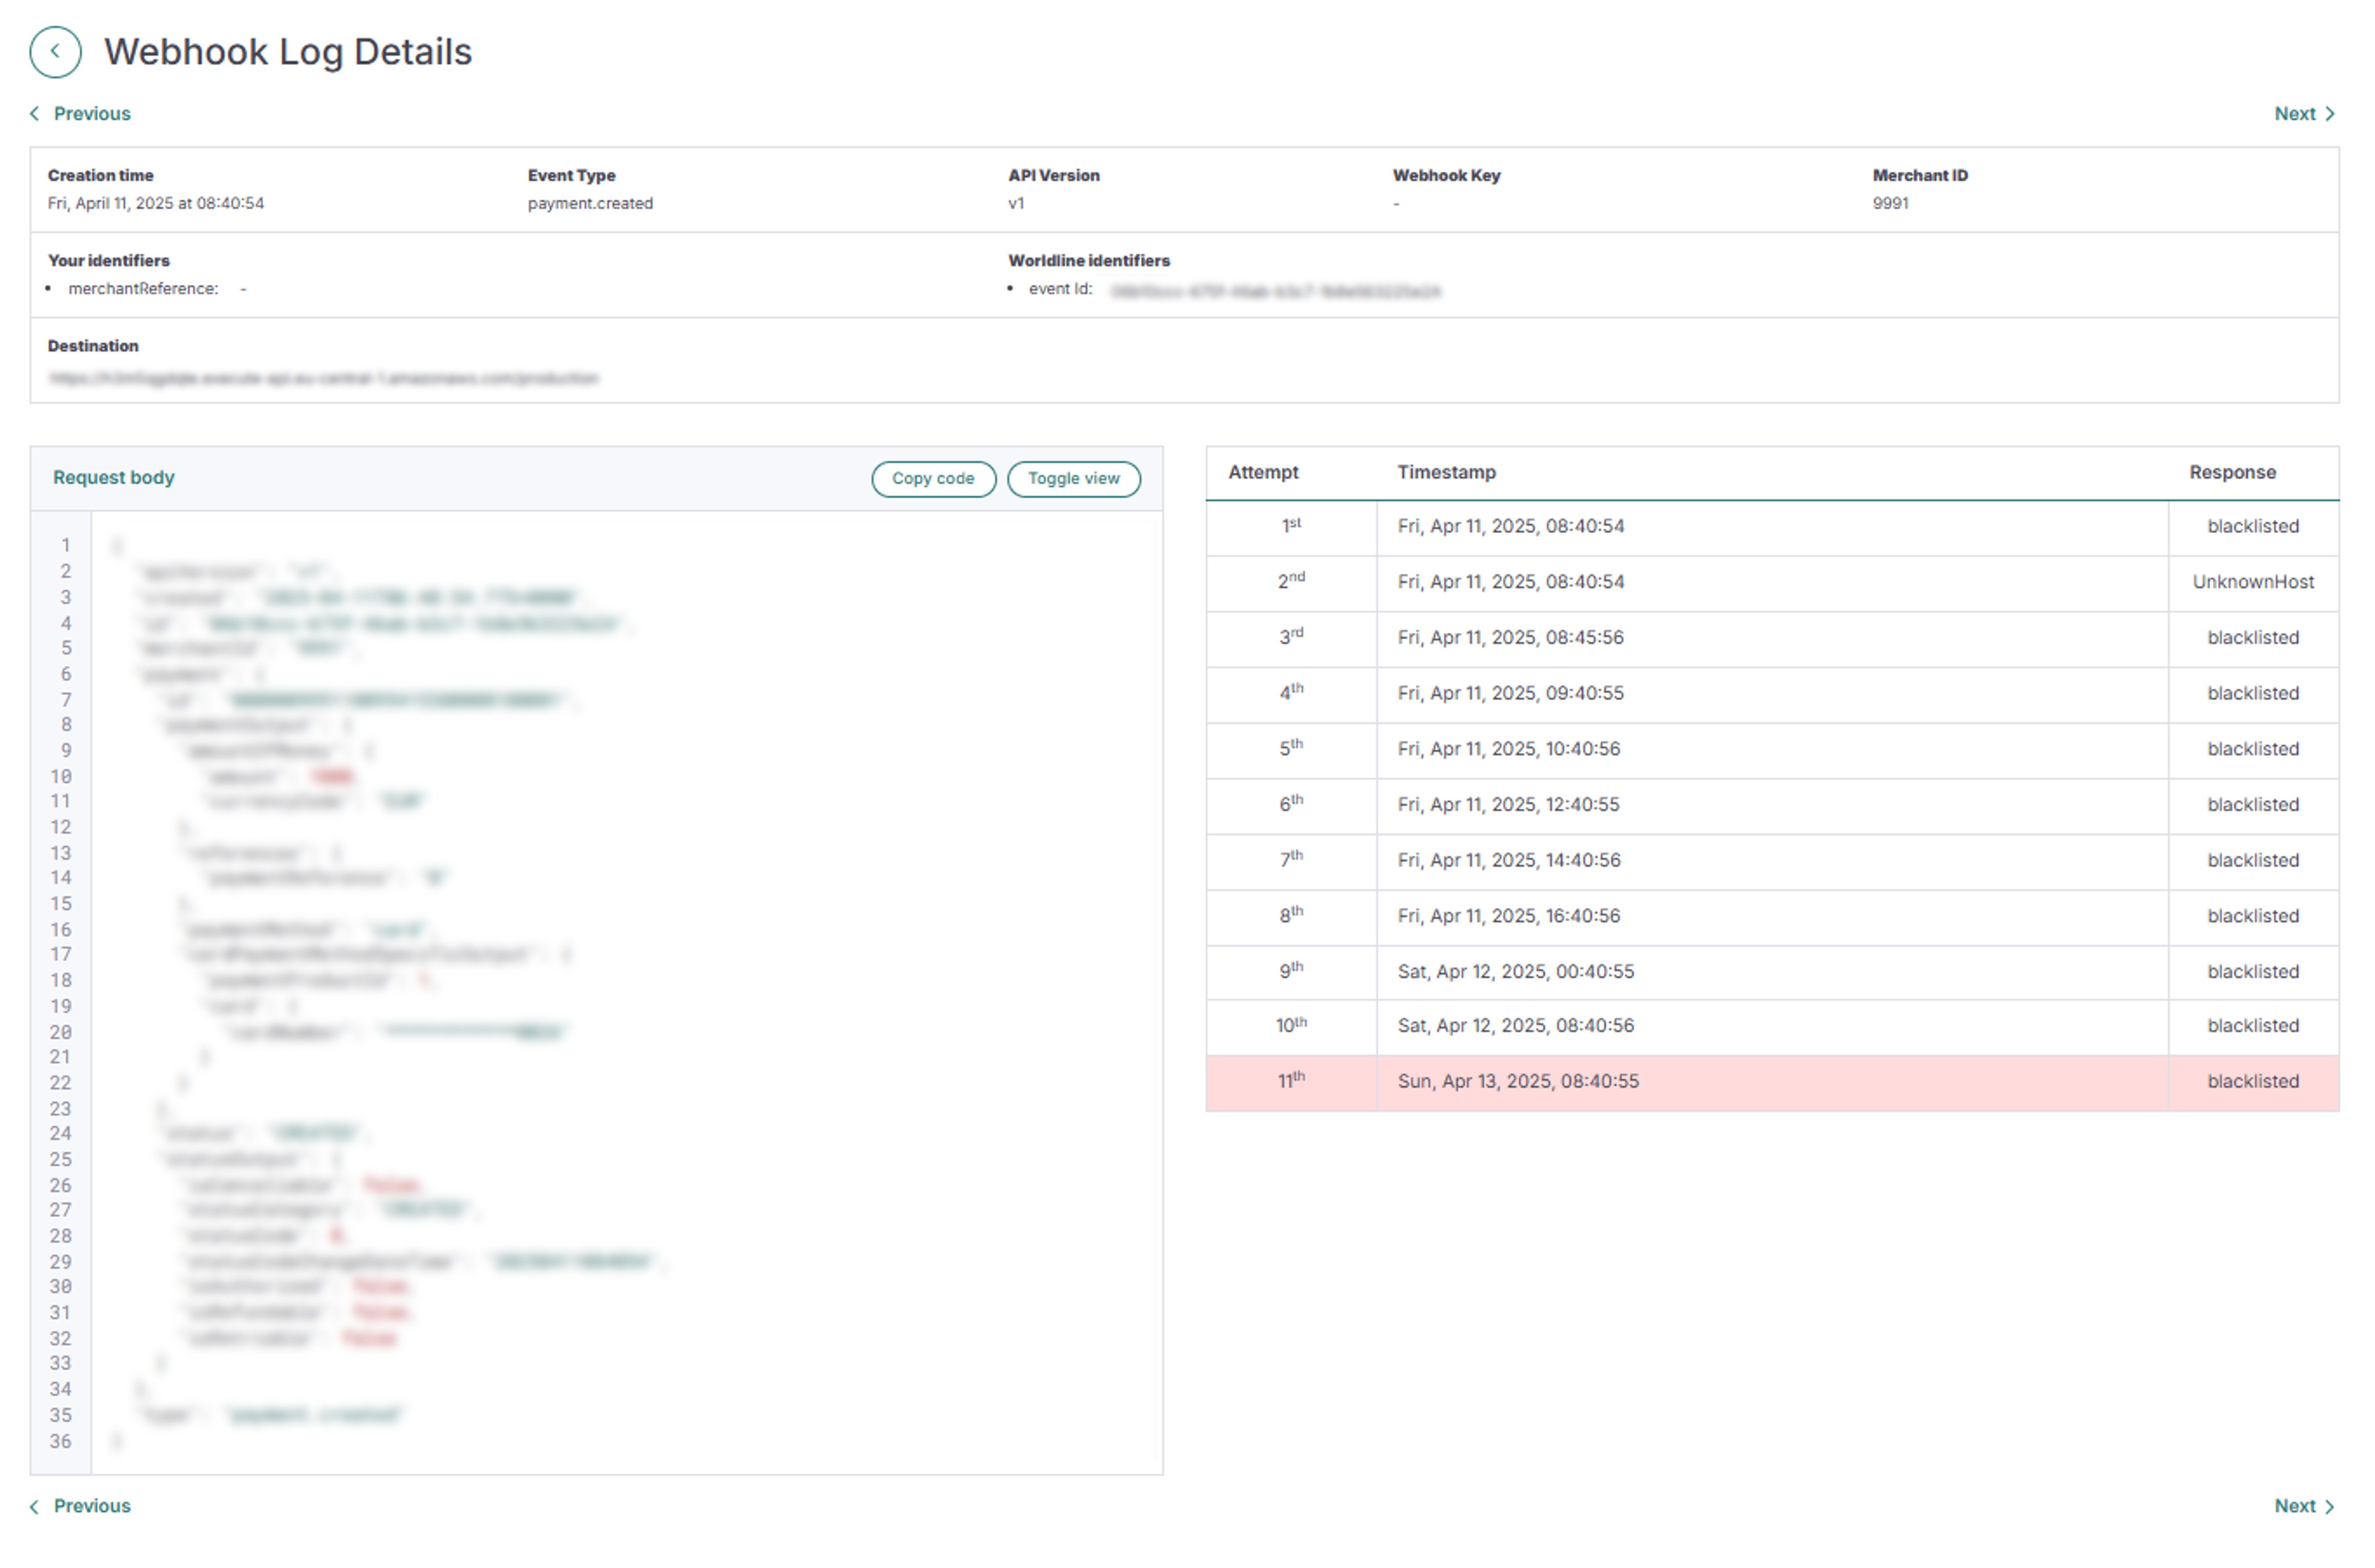
Webhook Log Details
View the specifics of an webhook event, including additional information such as:
- Timestamp
- Event type (for more information on event types please see: https://docs.connect.worldline-solutions.com/documentation/webhooks/event-types/
- Merchant ID
- Delivery status (e.g., Success, Failure)
- Attempt (attempt no)
- Destination (Webhook endpoint URL)
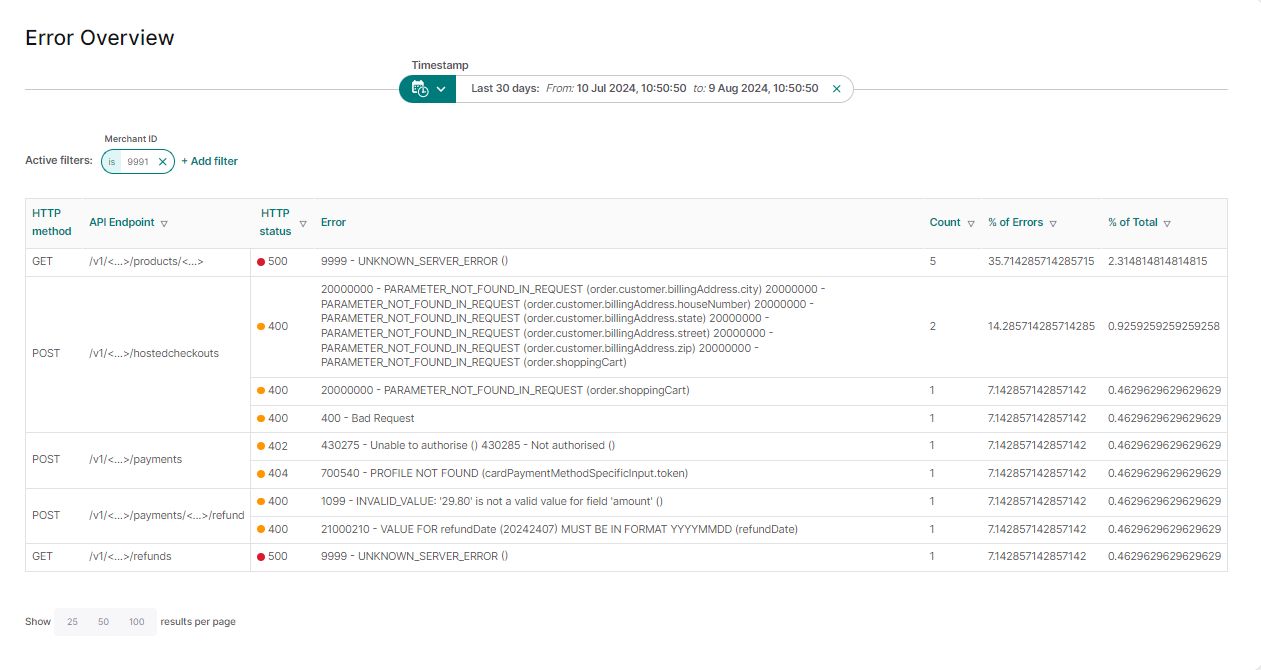
Error Overview
This page aggregates errors by API endpoint, providing a clear picture of where issues may be occurring. Detailed error information includes:
- HTTP Method: Method used by the API request (e.g., GET, POST).
- API Endpoint: The endpoint where the error occurred.
- HTTP Status: HTTP response code (e.g., 404, 500).
- Error: Error code and message (refer to our error codes documentation for more details).
- Count: Number of times this error occurred in the selected period.
- % of Errors: Percentage of this error type compared to the total errors in the same category.
- % of Total: Percentage of this error type compared to all errors.
Filtering
On each page of the dashboards you can filter data by a specific period and apply advanced filters.
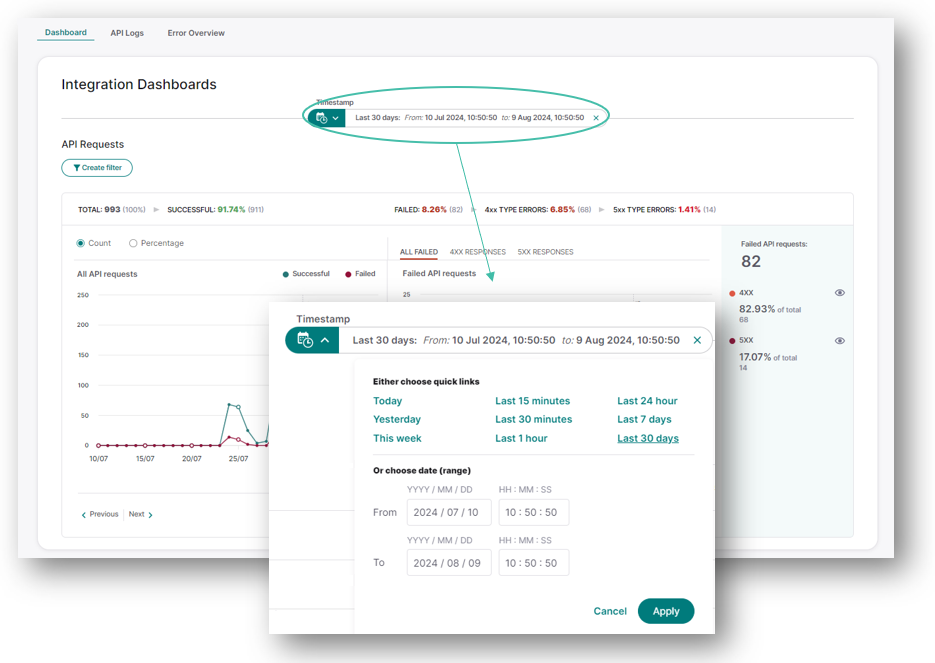
Filtering based on timestamp
- Click on the timestamp field to filter data by time.
- Select from pre-set options such as Today, Yesterday, or the Last 15 Minutes, or choose your own custom range.
- This filter will apply to all graphs for the selected period.
- The selected timestamp will remain consistent across all pages of the Integration Dashboards.
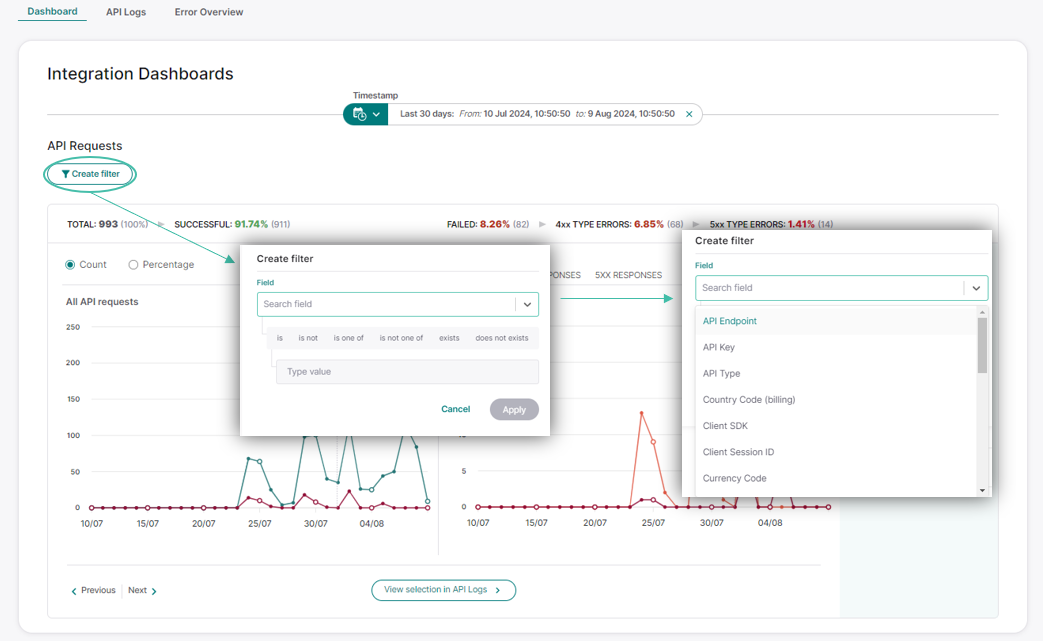
Advanced filtering
- Click "Create Filter" in the top-right corner to apply advanced filters (you can do this on any of the pages within the integration dashboards).
- Select the desired filter from the list.
- Choose your search criteria and click "Apply."
Available filter options
Filters available in both API Logs and Webhook Logs:
- Merchant ID: Connect merchantId used in the API request.
- Merchant Name: Your legal merchant name.
- Merchant Reference: Your unique transaction identifier.
- Payment ID: Unique identifier for each payment.
- Payment Product ID: Unique identifier for each payment product.
- Refund ID: Unique refund transaction identifier.
- Token ID: Token identifier generated by Worldline.
API Logs specific filters:
- API Authentication Type: Type of authorization used in the request (e.g., HMAC, Client session credentials).
- API Endpoint: Simplified endpoint without query strings. It always starts with a slash (/), examples include: /v1/<...>/payments, /v1/<...>/hostedcheckouts/<...>. For more information on available endpoints please check API Reference.
- API Key: Public API Key.
- API Type: Type of API used (e.g., Server API, Client API).
- Client Customer ID: Returned as customerId in the API response. It represents the customer around whom the session is built. All Client API requests use this ID in the URL path to identify the customer.
- Client SDK: Filters based on the SDK and version used on the client side. These values typically follow the format <ClientSDKName>/v<version>.
- Client Session ID: Temporary API Key for client authentication generated via the Server API. Valid for 2 hours from the creation.
- Country Code (Billing): Customer billing address country code (e.g., US, TR, NL).
- Currency Code: Currency code of the transaction (e.g., TL, USD, EUR).
- Dispute ID: Unique identifier for disputes.
- Error: Filters based on the code property inside the errors array returned in failed API responses. For more information please visit error codes documentation.
- Error ID: Filters based on the unique identifier for a failed API request. Returned as errorId in the response.
- Hosted Checkout ID: Identifier for a hosted checkout session, used to retrieve or reference checkout session data.
- HTTP Method: Supported HTTP methods (e.g., GET, POST).
- HTTP Response Code: HTTP status code returned by the API, indicating request outcomes (e.g., 2xx, 4xx, 5xx).
- Idempotence Key: Key used to retry the same API request without creating duplicates.
- Merchant Customer ID: Identifier assigned by you to your customers.
- Merchant Order ID: Your order identifier.
- Server SDK: Filters by SDK and version used on the server side. These values typically follow the format <Language>ServerSDK/v<version>.
Webhook Logs specific filters:
- Delivery Response: Indicates the result of a webhook delivery attempt to your endpoint. Values include HTTP response codes
(e.g., 4xx, 5xx) or Connect-generated results (e.g., BLACKLISTED, NOHTTPRESPONSE, SOCKETTIMEOUT) that means no response was received or no attempt was made. - Delivery Result: Outcome of the webhook delivery (e.g., SUCCESS, FAILED).
- Destination: URL where the webhook event was delivered.
- Event Type: Type of the webhook even triggered (e.g.,payment.paid,refund.created). For more information, check event types documentation.